
Music Therapy Infographics for Each Domain

One of the biggest challenges we face as music therapists is continually educating others about what we do and how much we have to offer as health care professionals.
Advocacy is an important and ever-present part of our clinical work. For this reason, it's important that we find ways to connect with others and share information about music therapy whenever we have the opportunity to do so.
In this blog post, I want to talk about how I created infographics for my private practice and why they've been so helpful for my community over the last few years.
When I first started this program, I was a solo practitioner in a rather isolated region. In terms of music therapy, there was hardly any access to care within hours of travel and members of the community were not familiar with what music therapy was.
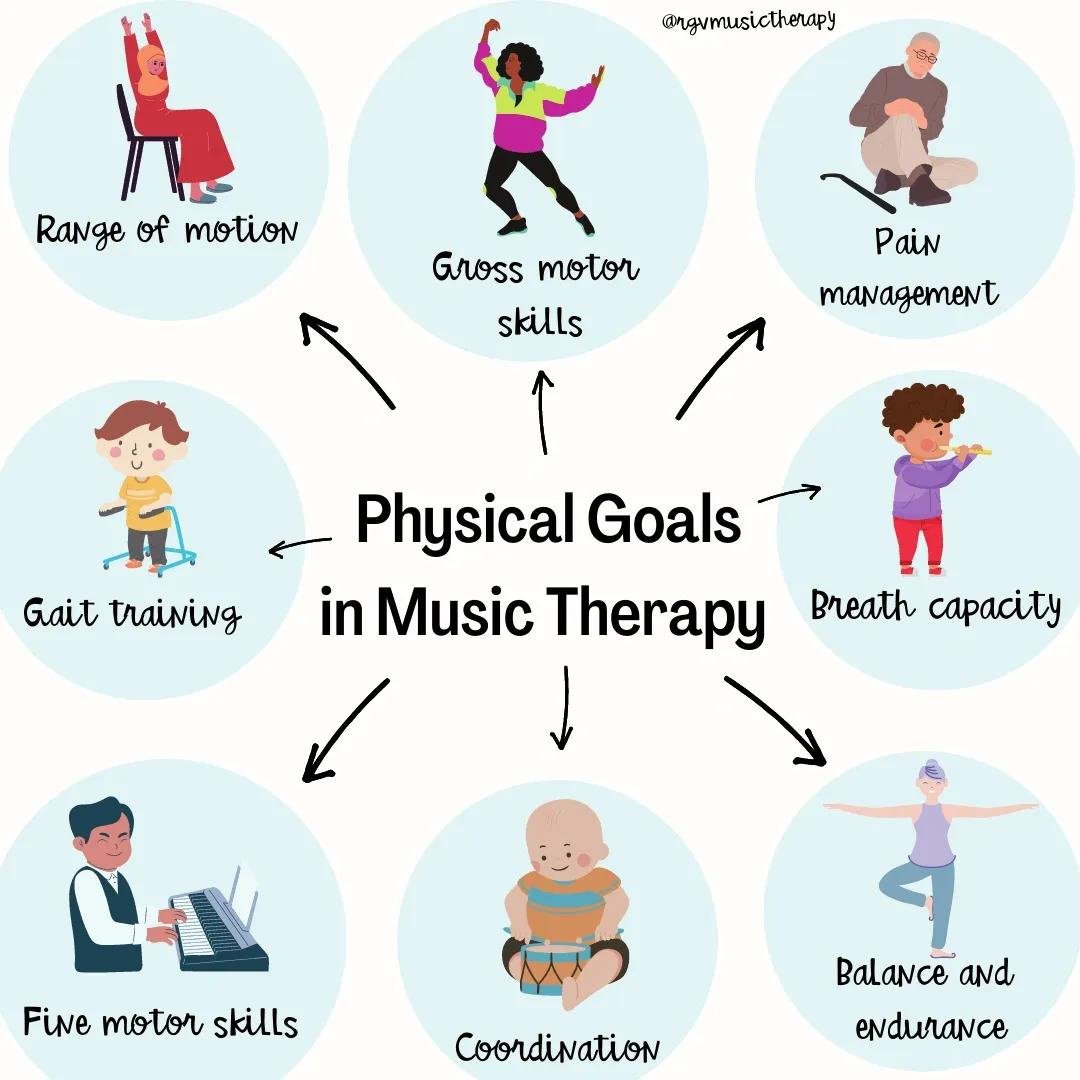
One thing that was really helpful for my clients and their treatment team was explaining music therapy in terms of its goals and objectives. This inspired me to create a series of infographics by domain.

When I was looking for ways to organize the information, I asked my brother, "What questions do you have about music therapy?" His response, like many others, was "Well, what do you do?". I answered him as I normally would describe music therapy, "We work on non-musical goals".
He looked at me kind of confused and asked another follow up question, "What does that even mean?".
It was then that I realized that I needed to be more specific, especially when talking to people that were not health care professionals. If I was speaking to another therapist (i.e. occupational, physical, speech therapists) then maybe saying "music for non-musical goals" would have made perfect sense; however, for a civil engineer that explanation was a bit daunting.
It was clear that I needed to find new ways to explain what exactly "non-musical goals" meant.
Once I started explaining the different domains and examples of goals that each domain could address, I could see the light bulb go off through his facial expression - the "aha moment".
After that conversation, I immediately opened my Canva (which I use at least ten times a day) and tried to create a visual that would summarize the entire conversation I had with my brother that day.
I started by listing each domain and writing out the most common goals that I see in my work here in the RGV with the caseload that I currently have. I tried to use terminology that would be helpful for client, families, and also other members of their treatment team including social workers, nurses, doctors, and more.

I posted them on our social medias over time and was surprised to see how well-received they were by clients who follow our pages, family members, staff, and even other music therapists in different parts of the world.
I was invited to speak about them on the Buddhaful Music podcast with Eric Lebowitz. Click here to hear the full episode.
I was also so grateful for the opportunity to collaborate with Özgür Salur and create translations of the infographics for his music therapy community in Turkey.
Music therapists here in the states have sent messages to our social media pages about how helpful the infographics have been for them in presentations. It's been so great to connect with others and see how much of a difference we can make if we find new ways to share how impactful music therapy can be!
We have also been able to translate them in Spanish to make them more accessible for our community along the Texas-Mexico border.

Although these infographics cannot encompass everything that music therapy has to offer, I hope that they provide a good foundation for understanding the potential scope of our practice.
Follow for more infographics and advocacy ideas and feel free to use these infographics as you need them!